

| Variables | Hypotheses | Data Tables | Graphs | Misc. |
| 100 | 100 | 100 | 100 | 100 |
| 200 | 200 | 200 | 200 | 200 |
| 300 | 300 | 300 | 300 | 300 |
| 400 | 400 | 400 | 400 | 400 |
| 500 | 500 | 500 | 500 | 500 |
| Final Question | ||||


What do we do with the IV in an experiment?
What do we do with the DV in an experiment?

What do we do with the IV in an experiment?
What do we do with the DV in an experiment?
Change
Measure
What is a control variable?
What is a control variable?
Something that does not change in an experiment (so that you are only testing the relationship between the IV and the DV).
Identify the IV and the DV in the following experimental question:
Will students who eat breakfast before school get better grades?
Identify the IV and the DV in the following experimental question:
Will students who eat breakfast before school get better grades?
IV: eating breakfast
DV: grades
Identify the IV, DV, and two control variables in the following hypothesis:
Will the type of medication taken affect how quickly someone's pain goes away?
Identify the IV, DV, and two control variables in the following hypothesis:
Will the type of medication taken affect how quickly someone's pain goes away?
IV: type of pain medication
DV: speed of pain relief
Controls: same person tested, same injury
Identify the IV, DV, and at least two controls in the following experimental question:
How will the amount of water given to a plant affect its growth?
Identify the IV, DV, and at least two controls in the following experimental question:
How will the amount of water given to a plant affect its growth?
IV: amount of water
DV: plant height (growth)
Controls: same species of plant, same exposure to sunlight
Define hypothesis.
Define hypothesis.
A prediction; and educated guess; a testable question
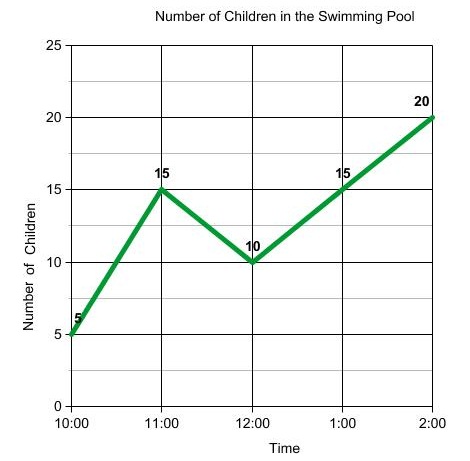
Do the data presented above support my hypothesis (see below)? Explain.
Hypothesis: If the time of the day increases, then the number of students in the pool will increase because children are more likely to swim as it gets hotter.
Do the data presented above support my hypothesis (see below)? Explain.
Hypothesis: If the time of the day increases, then the number of students in the pool will increase because children are more likely to swim as it gets hotter.
Yes, graph has a positive trend.
Write a hypothesis using the "if... then... because..." format given the following variables:
IV = acid level of a lake
DV = number of fish that live there
Write a hypothesis using the "if... then... because..." format given the following variables:
IV = acid level of a lake
DV = number of fish that live there
If the acid level of a lake increases, then the number of fish that live there will decrease because highly acidic lakes will not have enough food for the fish to survive.
Write a hypothesis in the "if... then... because" format for the following experimental question:
How does the amount of milk you drink affect your bone strength?
Write a hypothesis in the "if... then... because" format for the following experimental question:
How does the amount of milk you drink affect your bone strength?
If the amount of milk you drink increases, then one's bone strength will increase because... (ex: milk has calcium, which makes your bones strong).
Write a hypothesis in the "if... then... because" format for the following experimental question:
Will the amount of chocolate a teacher eats affect how much homework a class is assigned?
Write a hypothesis in the "if... then... because" format for the following experimental question:
Will the amount of chocolate a teacher eats affect how much homework a class is assigned?
If the amount of chocolate given to a teacher increases, then the amount of homework given to a class will decrease because... (ex: chocolate makes teachers happier and nicer).
What is wrong with this data table?
What is wrong with this data table?
It does not have a title.
How are data tables divided?
How are data tables divided?
Into rows and columns.
What is the drinkability of Mr. Fox's coffee 8 minutes after he made it? What is the temperature of the coffee? Explain how you knew this using the words row and column.
What is the drinkability of Mr. Fox's coffee 8 minutes after he made it? What is the temperature of the coffee? Explain how you knew this using the words row and column.
Drinkability: Perfect to sip
Temperature: 60 degrees Celsius

In which countries did total health IMPROVE from 2000 to 2001? Explain how you knew this using the words row and column.
In which countries did total health IMPROVE from 2000 to 2001? Explain how you knew this using the words row and column.
Canada and France
Do the information presented in the data table support my hypothesis (below)? Explain.
Hypothesis: If the proximity (closeness) to Australia increases, then the number of visitors will increase because it is easier and cheaper to get to Australia.
Proximity to Australia (closest to furthest): New Zealand, China, Italy, US, Canada, UK
Slight positive relationship (New Zealand, the closest, had the most visitors, but visitors from other countries varied)
What axis runs up and down?
Left and right (side to side)?
What axis runs up and down?
Left and right (side to side)?
y-axis
x-axis
Which variable is found on the x-axis?
The y-axis?
Which variable is found on the x-axis?
The y-axis?
IV
DV
What does a positive relationship look like?
A negative relationship?
No relationship?
What does a positive relationship look like?
A negative relationship?
No relationship?
Line going up
Line pointing down
Scattered data points, straight line

1. What relationship do you see in the graph above? Why?
2. Write a trend for this graph.
3. What is the value of Sarah's car in 2003?
1. What relationship do you see in the graph above? Why?
2. Write a trend for this graph.
3. What is the value of Sarah's car in 2003?
1. Negative (points downward)
2. As time increases, then the value of Sarah's car decreases.
3. $19,700

1. What relationships do you see on this graph?
2. Write at least one trend for the graph above.
3. When is population growth the highest?
1. What relationships do you see on this graph?
2. Write at least one trend for the graph above.
3. When is population growth the highest?
1. Pink: positive, Blue: no relationship
2. Trend: As time increases, then population increases.
3. Population growth is highest in 2100
Name two lab safety rules.
Name two lab safety rules.
Answers will vary.
How many more students prefer jazz music than students who prefer classical music?
How many more students prefer jazz music than students who prefer classical music?
30 students
What was the IV in this experiment? The DV? How did you know?
What was the IV in this experiment? The DV? How did you know?
IV: Day (on the x-axis)
DV: Number of cookies sold (on the y-axis)
What steps do we take when we are reading a scientific article?
What steps do we take when we are reading a scientific article?
1. Pre-read (look at title, section titles, pictures, vocab words, read questions you will need to answer).
2. Read article once to get a general idea of what's happening.
3. Read article a second time with an eye to the important information.
4. Answer article questions fully.
The Number of Goals Scored Over 5 Games

EXTENSION: Look at the data table above. Identify the IV and the DV. Explain your answer.
The Number of Goals Scored Over 5 Games
EXTENSION: Look at the data table above. Identify the IV and the DV. Explain your answer.
IV: Person
DV: Number of goals scored
1. What is the scientific method?
2. List at least three steps of the scientific method.
1. What is the scientific method?
2. List at least three steps of the scientific method.
1. A uniform process scientists use to test questions.
2. Answers will vary.

|
|
|
|
| ||||||||||||||||||||||||||||||
|
|
|
|
|
||||||||||||||||||||||||||||||


What Would You Like To Risk?
|
|
|
|
|
||||||||||||||||||||||||||||||
|
|
|
|
|
||||||||||||||||||||||||||||||
|
|
|
|
|
||||||||||||||||||||||||||||||
|
|
|
|
|
||||||||||||||||||||||||||||||
Review Game Info:

You must save this address to be able to find and share your game!