

| Pollution | Soil | Ecology | Climate Change | Energy |
| 10 | 10 | 10 | 10 | 10 |
| 20 | 20 | 20 | 20 | 20 |
| 30 | 30 | 30 | 30 | 30 |
| 40 | 40 | 40 | 40 | 40 |
| 50 | 50 | 50 | 50 | 50 |
| Final Question | ||||


An oil spill from a tanker in the ocean is known as this type of pollution source.

An oil spill from a tanker in the ocean is known as this type of pollution source.
Point Source Pollutant
Why can ozone be a pollutant as well as a necessary substance in the atmosphere?
Why can ozone be a pollutant as well as a necessary substance in the atmosphere?
It contriubes to acid rain when mixed with UV light and oxygen, but protects us from UV light when its in the stratosphere.
What kind of soil is best for a sanitary landfill?
What kind of soil is best for a sanitary landfill?
Clay
Explain 3 ways that a sanitary landfill is better than a non sanitary landfill.
Explain 3 ways that a sanitary landfill is better than a non sanitary landfill.
1. Clay lining prevents pollutants from leeching into the soil
2. Collection pipes to collect leachate, and methane gas
3. Closes when full.
In the dissolved oxygen curve, how would you know where the point of pollution occured, and explain why there would be a low oxygen level?
In the dissolved oxygen curve, how would you know where the point of pollution occured, and explain why there would be a low oxygen level?
You know where the point of pollution is when the dissolved oxygen levels start to decrease. There would be low levels of dissolved oxygen as eutrophication is occuring and the bacteria is using up the oxygen decomposing all the algae.
What are the 3 types of soil in an ecosystem?
What are the 3 types of soil in an ecosystem?
Clay, silt and sand
Which soil horizon has the most living matter?
Which soil horizon has the most living matter?
O horizon
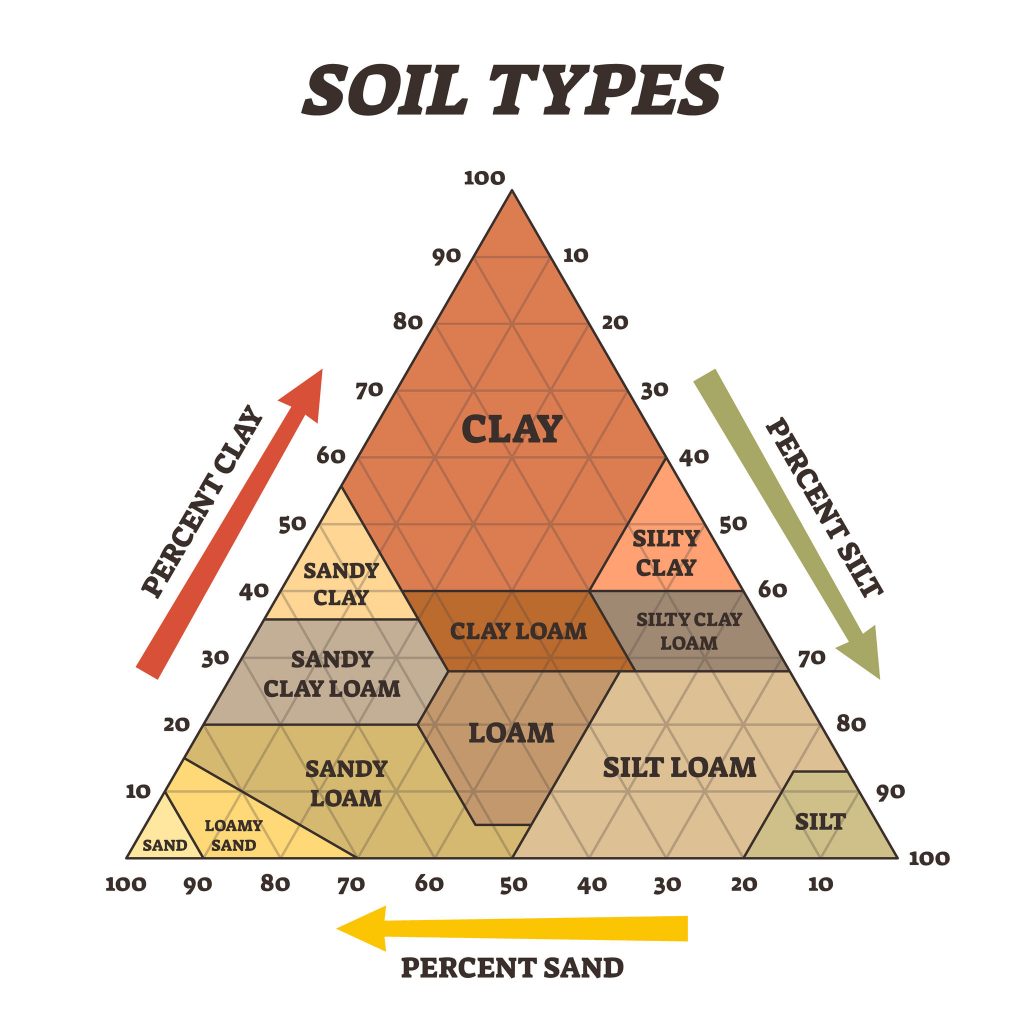
Based on the soil pyramid if a sample of soild has 60% sand 20% silt and 20% clay what type of soil is it?
Based on the soil pyramid if a sample of soild has 60% sand 20% silt and 20% clay what type of soil is it?
Sandy Clay loam
What type of plate boundary causes ocean floor spreading?
What type of plate boundary causes ocean floor spreading?
Divergant boundries
Explain why gravel and sand have a shorter time for permeability than silt or clay using the terms porosity and permeability.
Explain why gravel and sand have a shorter time for permeability than silt or clay using the terms porosity and permeability.
Gravel and sand are more porous so the water can flow easier than clay and silt. As a result gravel and sand are more permeable and water will permeate easier.
Explain the difference between a generalist and a specialist species.
Explain the difference between a generalist and a specialist species.
A generalist has an easier time adapting to an ecosystem as it can live or feed on a variety of things while a specialist can only live in certain areas or feed on certain things.
Using zootopia name a producer a primary consumer and a secondary consumer from the movie?
Using zootopia name a producer a primary consumer and a secondary consumer from the movie?
Producer- night howlers
Primary consumer- Judy Hopps
secondary consumer- Nick Wilde
From our mock trial explain how an invasive species can thrive when they are introduced to the new ecosystem.
From our mock trial explain how an invasive species can thrive when they are introduced to the new ecosystem.
They typically are r-startegists meaning they reach sexual maturity quickly and reproduce in large numbers, being in a new ecosystem they will have very few if any natural predators, so given all of this their population will explode rather qucikly leading to the invasives.
Given the following aquatic food web name a species and the impact it will feel if there was a sudden sickness that depleted the population of krill.
Given the following aquatic food web name a species and the impact it will feel if there was a sudden sickness that depleted the population of krill.
The squid will lose a food source so its population will decrease
Given the same food web; Name a species that is not on the food web and also name one mistake in this food web?
Given the same food web; Name a species that is not on the food web and also name one mistake in this food web?
The decomposers or the sun, and there are no arrows on the food web showing the flow of energy.
Name a green house gas
Name a green house gas
Carbon dioxide
sulfur oxides
nitrogen oxides
methane or natural gas
Name one anthropogenic source that will increase the likelihood of climate change and one non anthropgenic source.
Name one anthropogenic source that will increase the likelihood of climate change and one non anthropgenic source.
Burning of fossil fuels
deforestation
Non anthropogenic
Respiration
Name one way to combat climate change
Name one way to combat climate change
Car pooling
Switching to renewable energy sources
conserve energy by turning off appliances when not in use
reforestation
Explain why deforestation is one of the worst methods for climate change.
Explain why deforestation is one of the worst methods for climate change.
By cutting trees down you are elminating the one source that can remove carbon dioxide from the atmosphere and you are also removing shade that will increase the temperature as well. Also it decreases biodiversity
What area of the world has the worst effects of climate change and why?
What area of the world has the worst effects of climate change and why?
The poles have the most drastic effects of climate change as they also have a decrease in albedo affects which will cause the temperature to raise more as they lose the abliity to reflect the sunlight. They also have more ice which will melt and cause ocean levels to rise.
Name one type of renewable energy and one type of non renewable energy.
Name one type of renewable energy and one type of non renewable energy.
Renewable:
Hydroelectric
wind
solar
Geothermal
Nonrenewable
Natural gas
oil
coal
Explain the process of using a energy source to produce electricity.
Explain the process of using a energy source to produce electricity.
A turbine needs to spin whether its through wind blowing, water rushing past it, or steam running past it from the burning of fossil fuels. Then the turbine is connected to a generator which turns on when the turbine spins and that produces electricity which is connected to a wire that goes to the power company.
Explain one benefit and one negative of solar eerngy.
Explain one benefit and one negative of solar eerngy.
One benefit it doesn't give off any green house gases as a pollutant or contribute to climate change.
ONe negative it is only good when there is sun at night it is not generating any energy, it is expensive
Explain a drawback of nuclear energy?
Explain a drawback of nuclear energy?
Their waste products are radioative expoisng people to radiation and causing cancer as well as having no where to put the waste products which take a long time to decompose.
If it takes a car battery 5 years to be half as efficient as a new car battery, how efficient will the battery be in 30 years?
If it takes a car battery 5 years to be half as efficient as a new car battery, how efficient will the battery be in 30 years?
HLP = TT/ HL
x= 30 / 5 = 6 HLP
1= 100
2 = 50
3 = 25
4 = 12.5
5= 6.25
6 = 3.125 %

Given the following chart:
A) What stage would a developing country and a developed country be found in?
B) Explain why a developed country doesnt have their population growth continuing or why the birth rate is decreasing.
C) Explain why does the death rate start to decrease during stage 2?
D) Calculate the percent change of the birth and death rate per thousand from stage 2 to stage 4.
A demographer was studying the birth rates and death rates of a developed country and wanted to see the effect that economic opportunity would have on the birth rate. He created two groups of 10 families and watched how many kids the 2 groups had.
E) what is the dependent variable that the demographer was studying?
F) How could the demographer improve the accuracy of the experiment.
A) on looseleaf

|
|
|
|
| ||||||||||||||||||||||||||||||
|
|
|
|
|
||||||||||||||||||||||||||||||


What Would You Like To Risk?
|
|
|
|
|
||||||||||||||||||||||||||||||
|
|
|
|
|
||||||||||||||||||||||||||||||
|
|
|
|
|
||||||||||||||||||||||||||||||
|
|
|
|
|
||||||||||||||||||||||||||||||
Review Game Info:

You must save this address to be able to find and share your game!